Good enterprises know that data is beneficial for their growth. Intelligent businesses make use of that data to define a progressive trajectory in the future. Running an ecommerce store has become relatively difficult because of the continuously changing preferences of today’s i-dont-need-it-but-i-will-buy-it and i-want-it-right-now generation. The world is unpredictable, only to those who don’t have the eyes to see it. Businesses that pay close attention to data focus on evolving their business models with the changing trends and this very trait separates the sustainable companies from the rest. Amazon, Walmart and E-bay continue to lead the ecommerce space because of their biggest strength; data.
In Ecommerce industry, there are three main advantages of big data that help in setting up a stronger than ever platform for selling goods online:
- Decision making abilities have significantly improved with the advent of analytical tools. The early days method of basket analysis has been replaced by predictive algorithms.
- Not only these predictive algorithms are smart but quick too. This means, a lot of manual analysis time is saved by automated execution of the smart algorithms.
- Without even bringing it to the notice of customers, ecommerce platforms run multiple algorithms parallely to capture details and display relevant information to the customers.
What is a Data Metric? How is it different from a KPI?
First things first, all KPIs are metrics – but not all metrics are KPIs.
Metrics can be considered as data pointers that define different objectives. KPIs, on the other hand, are pointers with subjective value that provide insightful information relevant to a certain business. Organizations that are contented by recording just the metrics do not really get their hands on the information that might be valuable for their business decisions. This is where the Key Performance Indicators come into play. While we measure the KPIs in an objective manner only, the assessment of these indicators is subjective. Having said that, KPIs are closely related with metrics as the qualified metrics by any organisation are said to be the Key Performance Indicators.
Customer Lifetime Value
Business organisations that aim to sustain in the long-term often have one thing in common; loyal customers. Enterprises that focus on keeping their customers happy in order to retain them forever have a favorite metric i.e. Customer Lifetime Value. Rather than spending more money to attract new customers all the time, it is better and cost-effective to work on the ones that the organisation has already earned. For this purpose, it is completely sensible to record the second, third and fourth purchases.
To calculate the Customer Lifetime Value, you must understand its two different types:
- Historical Customer Lifetime Value- Value based upon the past purchases
- Predictive Customer Lifetime Value – Predicted Customer Lifetime Value on the basis of past behavior

Sales Conversion Rate
Running a successful marketing strategy for your ecommerce store results in website traffic elevation. At the same time, you realize that the same effect cannot be observed in terms of business sales. Thus, you must always know the sales conversion rate of your online store in order to read between the lines. Again, this is one of the key metrics used in analysing the performance of the ecommerce store and you can calculate it using the given formula:
Total Sales / Total Users or Visitors

To track such metrics, you can either use an analytics tools like Google Analytics or you can use the sales records that are stored within the third party ecommerce platform like in case of Amazon. If you are already tracking this metric for your ecommerce store, then you can probably optimize your ecommerce to enhance this number. Here is what you can do:
- Product listings can be optimized using keywords as per the ecommerce algorithms.
- Pay close attention to web copies and the quality of images used for products or services.
- Focus on creating a value-based price structure
- Understand your customer feedback and reviews
Average Order Value
So, you are just like other ecommerce store owners who wants their customers to shed more money in order to purchase goods from your store. But what are you really doing about it? Flashing expensive products on their face that they would not even care about. Okay, one out of ten might. In that event, you must watch out the spending behavior of your customers. Depending upon the purchases made by customers over a certain period of time, you can calculate the Average Order Value. It not only helps you in understanding the buying behavior of your customers but measure the performance of your marketing campaigns that you have been running for that matter. To calculate AOV, you need to use this simple formula:
Total revenue / Total number of product sales
Cart Abandonment Rate
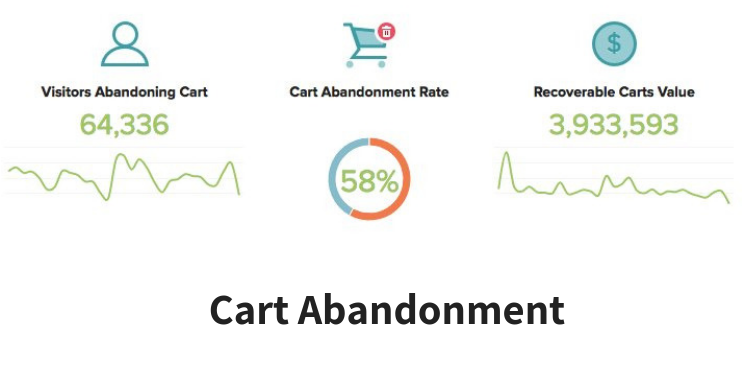
Card abandonment is an ecommerce specific problem and majority of the online store owners face this. Customers often add multiple products in their carts but do not checkout which results in incomplete purchases. As per a recent survey, more than 58% of the US population who abandoned their cart gave the reason of casual browsing behind it. Understanding that the issue of casual browsing cannot be really resolved, there are other reasons due to which customers abandon carts such as long checkout processes, not-so-secure payment methods.

Number of completed purchases / Number of shopping carts created
Resolution of checkout usability can have a direct impact on your card abandonment figures. An ecommerce website with highly usable interface and simplified checkout process can increase the sales conversion rates by 36%. Evidently, this gives us more reason to focus on finding the cart abandonment rate.
Email Conversion Rate
Fancy emails can give you a great open rate but sadly that isn’t what you are trying to achieve when you have products to sell. Ecommerce stores can generate majority of their revenue through effective email marketing, approximately 175% more than the social media marketing campaigns. This means that an ideal email marketing plan should be in place. But to understand if it is benefiting your business or not, you need to assess the email marketing metrics such as open rate, bounce rate, click-throughs and unsubscribes. Having said that, here is the equation that will help you find email conversion rate for your online store:
Number of sales from emails / number of total emails delivered Email Conversion to Revenue

Social Media Conversion Rate
Huge followings on Social Media platforms measured in thousands or millions are futile if nobody is really buying from your store. To understand how your followers are interacting with your brand, you must use social media metrics for every platform. You must look beyond the likes, comments, retweets and comments which means focusing on more meaningful metrics can help in modifying your strategy for better sales. Tools such as Google Analytics can help you track traffic source and medium on your store to understand which social media is working for you and which is not. Moreover, you can analyse performance of different posts as per time, audience and other attributes. This is an ongoing process that can generate varied results all the time but ecommerce store owners must track social media conversion rate, after all it is all about money. Here is how you can calculate it:
Total sales from social media / Total posts

Revenue As Per Traffic Sources
Like mentioned in the previous point, tracking traffic sources plays a vital role in figuring out effective platforms that you can optimize for more revenues. To strategize better, you must monitor sales conversion rates with respect to the traffic sources. This will help in optimizing costs spent on Paid Ads on different channels and accordingly you will be able to use your budget on the more effective social media channel.
Customer Acquisition Cost
Customer Acquisition Cost, in simple terms, can be defined as the cost spent on acquiring customers for your business. CAC metric is again one of the most important metrics to track for your online shopping platform. By evaluating CAC as per your marketing expenditure for different platforms, you can focus on the platform that is generating more customers with minimum cost as compared to others. To maximize the ROI (return on investment) of your business, tracking and utilizing insights regarding CAC is mandatory. The formula to calculate CAC is:
Amount spent on customer acquisition / Customers acquired
You can apply this formula as per different social platforms and then compare all of them to find out the most profitable one. To optimize your Customer Acquisition Cost, you should focus on improving the on-site conversion metrics, enhancing the user experience and establishing qualitative customer relationship management with the helps of referral or loyalty programs.
Returning Customer Percentage
Now that we are on eighth metric, we already know that it is not wise to spend loads of money in attracting new customers. Instead, it is wiser and more profitable for a business to retain customers. Thus, we should focus on the metric that gives specific insights related to returning customers. To track the returning customer percentage, you can use the below stated formula:
Number of returning customers / Total customers
Website Engagement
Website engagement analysis is equally important as measuring external aspects such as email marketing conversions, social media etc. With the help of standard on-site website metrics, you can track the effectiveness of your Call-to-action buttons and assess different aspects about your visitors. Here are a few important metrics that you can record to plan your marketing campaigns better.
- Session Duration
- Unique Session
- Bounce Rate
- Returning VS New Customers
- Pages per Session

These metrics are not going to help you if you simply record these in spreadsheets. When framing the next marketing campaign or at the time of optimizing the website, you can always make use of these insightful data pointers to make informed decisions about your online store.
Do let us know, how you implement these metrics in your business.


